[Update 2016/03/15] An official article has been released with proper guidance and no need for any SQL management tools at all. It’s available here: https://technet.microsoft.com/en-us/library/mt693376.aspx
I’ve got a customer who has deployed Direct Access quite a while ago. Something which we have observed for a while now is that the CPU usage of the servers is rather high. Some details about our setup: we got 2 Direct Access servers which are load balanced using Windows NLB. They are running Windows 2012 R2, have 4 vCPU’s and 8 GB of RAM. When troubleshooting this issue, we were seeing 400 active users, roughly 200 for each server. Here’s what the CPU usage looked like:

As you can see sqlservr.exe is using 67% CPU. Now that’s quite a lot… I would hope a DA server had other things to do with it’s CPU instead of running an SQL instance. Now I know where this instance comes from. We configured inbox accounting on the Direct Access servers. This allows an administrator to pull up reports about who connected when to what resources. You can choose between Radius and Windows Internal Database (WID) for the auditing data targets. We choose the WID approach. We configured our accounting to hold data for 3 months. So I started wondering, is the SQL database instance having troubles with the amount of data? Or is there an issue with indexes that are fragmented or… In order to investigate this, we’d had to do some SQL talking to this instance. As it’s a WID instance, we can only talk to it from the box itself. So we can either install the SQL commandline tools or the SQL Management Studio. I’m not an SQL guru, so I prefer to do my troubleshooting using the SQL Management Studio. In order to determine what version you can use you can check the location for the sqlservr.exe binary:

And from the details you can see that a WID on a Windows 2012 R2 is actually build 11.0.2100.60 which, if bing is correct, is a SQL 2012 edition.

So I took the SQL 2012 iso and installed the SQL Management Studio on the DA servers. Watch out when going through the setup, we don’t want to install another SQL instance! Just the management tools. Here’s the string we can use to connect to the instance: \\.\pipe\MICROSOFT##WID\tsql\query

After connecting to the instance we see that there’s only one Database (RaAcctDb) which has 4 tables. This query I found here: TechNet Gallery and also resembles the query that is presented here: KB2755960. To check all indexes for fragmentation issues, execute the following query:
SELECT OBJECT_NAME(ind.OBJECT_ID) AS TableName,
ind.name AS IndexName, indexstats.index_type_desc AS IndexType,
indexstats.avg_fragmentation_in_percent
FROM sys.dm_db_index_physical_stats(DB_ID(), NULL, NULL, NULL, NULL) indexstats
INNER JOIN sys.indexes ind
ON ind.object_id = indexstats.object_id
AND ind.index_id = indexstats.index_id
WHERE indexstats.avg_fragmentation_in_percent > 30
ORDER BY indexstats.avg_fragmentation_in_percent DESC
No indexes were returned. Another thing which I hear from time to time is rebuild “statistics”. So I checked them and I saw they were two weeks old. I figured rebuilding them couldn’t hurt:
use RaAcctDb;
UPDATE STATISTICS connectionTable
WITH FULLSCAN
GO
use RaAcctDb;
UPDATE STATISTICS EndpointsAccessedTable
WITH FULLSCAN
GO
use RaAcctDb;
UPDATE STATISTICS ServerEndpointTable
WITH FULLSCAN
GO
use RaAcctDb;
UPDATE STATISTICS SessionTable
WITH FULLSCAN
GO
Again no real change in CPU usage… Ok, back to the drawing board. I googled a bit for “high cpu usage SQL” and I found the following blog: http://mssqlfun.com/2013/04/01/dmv-3-what-is-currently-going-on-sys-dm_exec_requests-2/ One of the queries there is this one:
SELECT
R.SESSION_ID,
R.REQUEST_ID AS SESSION_REQUEST_ID,
R.STATUS,
S.HOST_NAME,
C.CLIENT_NET_ADDRESS,
CASE WHEN S.LOGIN_NAME = S.ORIGINAL_LOGIN_NAME THEN S.LOGIN_NAME ELSE S.LOGIN_NAME + '(' + S.ORIGINAL_LOGIN_NAME + ')' END AS LOGIN_NAME,
S.PROGRAM_NAME,
DB_NAME(R.DATABASE_ID) AS DATABASE_NAME,
R.COMMAND,
ST.TEXT AS QUERY_TEXT,
QP.QUERY_PLAN AS XML_QUERY_PLAN,
R.WAIT_TYPE AS CURRENT_WAIT_TYPE,
R.LAST_WAIT_TYPE,
R.BLOCKING_SESSION_ID,
R.ROW_COUNT,
R.GRANTED_QUERY_MEMORY,
R.OPEN_TRANSACTION_COUNT,
R.USER_ID,
R.PERCENT_COMPLETE,
CASE R.TRANSACTION_ISOLATION_LEVEL
WHEN 0 THEN 'UNSPECIFIED'
WHEN 1 THEN 'READUNCOMITTED'
WHEN 2 THEN 'READCOMMITTED'
WHEN 3 THEN 'REPEATABLE'
WHEN 4 THEN 'SERIALIZABLE'
WHEN 5 THEN 'SNAPSHOT'
ELSE CAST(R.TRANSACTION_ISOLATION_LEVEL AS VARCHAR(32))
END AS TRANSACTION_ISOLATION_LEVEL_NAME
FROM
SYS.DM_EXEC_REQUESTS R
LEFT OUTER JOIN SYS.DM_EXEC_SESSIONS S ON S.SESSION_ID = R.SESSION_ID
LEFT OUTER JOIN SYS.DM_EXEC_CONNECTIONS C ON C.CONNECTION_ID = R.CONNECTION_ID
CROSS APPLY SYS.DM_EXEC_SQL_TEXT(R.SQL_HANDLE) ST
CROSS APPLY SYS.DM_EXEC_QUERY_PLAN(R.PLAN_HANDLE) QP
WHERE
R.STATUS NOT IN ('BACKGROUND','SLEEPING')
The result:

It returns one ore more queries the SQL instance is currently working on. It’s actually pretty easy and very powerful. The first record is a sample entry we care about. The others are me interacting with the SQL management studio. Scroll to the right and you’ll see both the execution plan and the actual query. Now how cool is that?!

There we can get the query being executed (QUERY_TEXT)
CREATE PROCEDURE raacct_InsertSession (
@Hostname NVARCHAR(256),
@ClientIPv4Address BINARY(4),
@ClientIPv6Address BINARY(16),
@ClientISPAddressType SMALLINT,
@ClientISPAddress VARBINARY(16),
@ConnectionType TINYINT,
@TransitionTechnology INT,
@TunnelType INT,
@SessionHandle BIGINT,
@Username NVARCHAR(256),
@SessionStartTime BIGINT,
@AuthMethod INT,
@HealthStatus INT) AS
BEGIN
DECLARE @SessionId BIGINT
DECLARE @ConnectionId BIGINT
DECLARE @NumActiveSessions SMALLINT
IF (@SessionHandle IS NULL OR @SessionHandle = 0)
BEGIN
-- error (BAD PARAMETER)
RETURN (1)
END
IF (@SessionStartTime IS NULL OR @SessionStartTime = 0)
BEGIN
-- error (BAD PARAMETER)
RETURN (1)
END
SELECT @SessionId = 0
BEGIN TRANSACTION
SELECT @SessionId = [SessionId]
FROM [dbo].[SessionTable]
WHERE @SessionHandle = [SessionHandle]
AND @SessionStartTime = [SessionStartTime]
IF (@@ROWCOUNT > 0)
BEGIN
-- error (session already exists)
ROLLBACK TRANSACTION
RETURN (2)
END
-- check if connection exists
SELECT @ConnectionId = connTbl.[ConnectionId]
FROM [dbo].[ConnectionTable] AS connTbl, [dbo].[SessionTable] AS sessTbl
WHERE sessTbl.SessionState = 1
AND connTbl.ConnectionId = sessTbl.ConnectionId
AND connTbl.Hostname = @Hostname
AND connTbl.ClientIPv4Address = @ClientIPv4Address
AND connTbl.ClientIPv6Address = @ClientIPv6Address
AND connTbl.ClientISPAddressType = @ClientISPAddressType
AND connTbl.ClientISPAddress = @ClientISPAddress
AND connTbl.ConnectionType = @ConnectionType
AND connTbl.TransitionTechnology = @TransitionTechnology
AND connTbl.TunnelType = @TunnelType
IF @@ROWCOUNT = 0
BEGIN
-- create connection record
INSERT INTO [dbo].[ConnectionTable] ([Hostname],
[ClientIPv4Address],
[ClientIPv6Address],
[ClientISPAddressType],
[ClientISPAddress],
[ConnectionType],
[TransitionTechnology],
[TunnelType]
)
VALUES (@Hostname,
@ClientIPv4Address,
@ClientIPv6Address,
@ClientISPAddressType,
@ClientISPAddress,
@ConnectionType,
@TransitionTechnology,
@TunnelType
)
IF @@ERROR <> 0
BEGIN
-- error (failed to create connection), return from here
ROLLBACK TRANSACTION
RETURN (99)
END
SET @ConnectionId = @@IDENTITY
END
SELECT @NumActiveSessions = COUNT(SessionHandle)
FROM [dbo].[SessionTable]
WHERE [SessionState] = 1
SET @NumActiveSessions = @NumActiveSessions + 1
INSERT INTO [dbo].[SessionTable] ([ConnectionId],
[SessionHandle],
[Username],
[SessionStartTime],
[AuthMethod],
[HealthStatus],
[NumConcurrentConnections]
)
VALUES (@ConnectionId,
@SessionHandle,
@Username,
@SessionStartTime,
@AuthMethod,
@HealthStatus,
@NumActiveSessions
)
IF @@ERROR <> 0
BEGIN
ROLLBACK TRANSACTION
RETURN (4)
END
COMMIT TRANSACTION
END
The only thing I can see, with my limited SQL knowledge, is that potentially performance hits might occur on the where statements:
FROM [dbo].[SessionTable]
WHERE @SessionHandle = [SessionHandle]
AND @SessionStartTime = [SessionStartTime]
And
FROM [dbo].[ConnectionTable] AS connTbl, [dbo].[SessionTable] AS sessTbl
WHERE sessTbl.SessionState = 1
AND connTbl.ConnectionId = sessTbl.ConnectionId
AND connTbl.Hostname = @Hostname
AND connTbl.ClientIPv4Address = @ClientIPv4Address
AND connTbl.ClientIPv6Address = @ClientIPv6Address
AND connTbl.ClientISPAddressType = @ClientISPAddressType
AND connTbl.ClientISPAddress = @ClientISPAddress
AND connTbl.ConnectionType = @ConnectionType
AND connTbl.TransitionTechnology = @TransitionTechnology
AND connTbl.TunnelType = @TunnelType
The where statements act as filters and columns they use are often indexed. Without an index the SQL server would have to scan the complete table looking for the records. Now on smaller tables that’s not an issue but the SessionTable table contains 14.482.972 records!

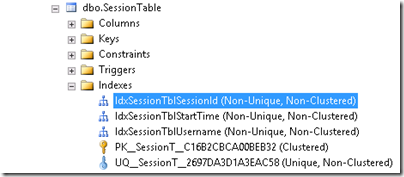
So if we check the indexes for that table, one would hope SessionHandle, SessionStartTime and SessionState to be present:

The last one UQ_SessionT… seems to have both SessionHandle and SessionStartTime in it. So I guess that should satisfy the first where statement:

Now what about SessionState? I can’t seem to find that one… Now back to our query that showed us the query being executed. There’s also an XML_QUERY_PLAN. It’s clickable in the Management Studio:

See how this query cost shows 50%? Further down there’s another Query that shows the other 50%. Both show “missing index”:

As previously stated, I’m not an experienced SQL engineer/DBA. I try to crosscheck stuff I find online before applying it. Also I wouldn’t do this kind of stuff on a FIM Service or SCCM database. Those are pretty complex databases. But I made a personal assessment and the Direct Access auditing database seems simple enough to tinker with it. So I decided to give it a try and create the index. Undoing this is pretty straightforward, so I guess there’s no real harm in going forward. Right-click one of the existing indexes and choose Script Index as > CREATE To > New Query Editor Window

Simply change both the Index name and the column to “SessionState”. And execute the query. After refreshing the UI you can see the index:

And there goes the CPU usage:

Conclusion: to me it looks like the DA team just forgot this particular index. From the other indexes you can tell they actually did something for those. I’m not really sure why we didn’t just log a case with Microsoft. Partially I guess because we were afraid/guessing we’d get the answer: by design with that amount of auditing data. But after this troubleshooting session we can clearly see there’s shortcoming in the SQL database setup. As with most stuff you read on the internet: be careful when applying in your environment. If you do not know what commands/queries you’re executing, look them up and do some background reading.


6 comments