Recently I had an intriguing issue at one of my customers I frequently visit. They saw their domain controllers having a CPU usage way above what we normally saw. Typically their domain controllers have between 0 – 15% CPU usage whereas now we saw all of their domain controllers running at 80 – 90% during business hours. A quick look showed us that the process which required this much CPU power was lsass.exe. Lsass.exe is responsible for handling all kind of requests towards Active Directory. If you want you can skip to the end to find the cause, but I’ll write this rather lengthy post nevertheless so that others can learn from the steps I took before finding the answer.
Some background: the environment consists of approximately 20.000 users. Technologies in the mix: Windows 7, Windows 2008 R2, SCCM, Exchange, … Our Domain Controllers are virtual, run 2008 R2 x64 SP1, have 4 vCPU’s and 16 GB RAM. RAM is a bit oversized but CPU is really the issue here. There are 8 Domain Controllers.
Here you can see a screenshot of a more or less busy domain controller. It’s not 80% on this screenshot but it’s definitely much more than we are used to see. Task Manager shows us without doubt that lsass.exe is mainly responsible.
Whenever a domain controller (or server) is busy and you are trying to find the cause, it’s a good idea to start with the built-in tool Perfmon. In the Windows 2003 timeframe articles you’ll see that they mention SPA (Server Performance Advisor) a lot, but for Windows 2008 R2 and up you don’t need this separate download anymore. Its functionality is included in Perfmon. Just go to Start > Run > Perfmon
Open up Data Collector Sets > System and right-click Active Directory Diagnostics > Start. By default it will collect data for 5’ and then it will compile a nice HTML report for you. And that’s where things went wrong for me. The compiling seemed to take a lot of time (20-30 minutes) and after that I ended up with no performance data and no report. I guess the amount of data to be processed was just to much. I found a workaround to get the report though:
While it is compiling: copy the folder mentioned in “Output” to a temporary location. In my example C:\PerfLogs\ADDS\20140909-0001
If the report would fail to compile you will see that the folder will be emptied. However we can try to compile to report for the data we copied by executing the following command:
- tracerpt *.blg *.etl -df RPT3870.tmp-report report.html -f html
The .tmp file seems to be crucial for the command and it should be present in the folder you copied. Normally you’ll see again that lsass.exe is using a lot of CPU:
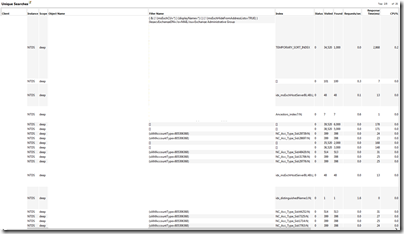
The Active Directory section is pretty cool and has a lot of information. For several categories you can see the top x heavy CPU queries/processes.
A sample for LDAP queries, I had to erase quite some information as I try to avoid sharing customer specific details.
However in our case, for all of the possible tasks/categories, nothing stood out. So the search went on. We took a network trace on a domain controller using the built-in tracing capabilities (Setspn: Network Tracing Awesomeness)
- Netsh trace start capture=yes
- Netsh trace stop
In our environment taking a trace of 20 minutes or 1 minute resulted in the same. Due to the large amount of traffic passing by, only 1 minute of tracing data was available in the file. The file was approximately 130 MB.
Using Microsoft Network Monitor (Microsoft.com: Network Monitor 3.4 ) the etl file from the trace can be opened and analyzed. However: 1 minute of tracing contained about 328041 frames (in my case). In order to find a needle in this haystack I used the Top Users expert (Network Monitor plugin): Codeplex: NMTopUsers This plugin will give you an overview of all IP’s that communicated and how many data/packets they exchanged. It’s an easy way to see which IP is communicating more than average. If that’s a server like Exchange that might be legit, but if it’s a client something might be off.
As a starting point I took an IP with many packets:
I filtered the trace to only show traffic involving traffic with that IP
- IPv4.Address == x.y.z.a
Going through the data of that specific client seemed to reveal a lot of TCP 445 (SMB) traffic. However in Network Monitor this was displayed as all kinds of protocols:
- SMB2
- LSAD
- LSAT
- MSRPC
- SAMR
As far as I can tell it seems that TCP 445 (SMB) is being used as a way for certain protocols to talk to Active Directory (lsass.exe on the domain controller). When a client logs on, you could explain TCP 445 as group policy objects being downloaded from the SYSVOL share. However in our case that definitely didn’t seem to be case. Browsing a bit through the traffic, it seemed that the LSAT and SAMR messages were more than interesting. So I changed my display filter:
- IPv4.Address == x.y.z.a AND (ProtocolName == “LSAT” OR ProtocolName == “SAMR”)
This resulted in traffic being displayed which seemed pretty easy to read and understand:
It seemed that the client was doing a massive amount of LsarLookupNames3 request. A typical request looked like this:
Moreover by opening multiple requests I could see that each request was holding a different username to be looked up. Now why would a client be performing queries to AD that seemingly involved all (or a large subset) of our AD user accounts. In my case, in the 60’ seconds trace I had my top client was doing 1015 lookups in 25 seconds. Now that has to count for some load if potentially hundreds of clients are doing this.
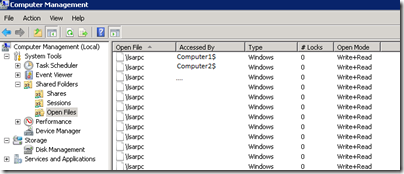
As the traffic was identified as SMB, I figured the open files (Computer Management) on the domain controller might show something:
Seems like a lot client have a connection to \lsarpc
And \samr is also popular. Now I got to be honest, both lsarpc and samr were completely unknown to me. I always thought whatever kind of lookups have to be performed against AD are over some kind of LDAP.
After using my favourite search engine I came up with a bit more background information:
It seems LsarOpenPolicy2, LsarLookupNames3, LsarClose are all operations that are performed against a pipe that is available over TCP 445. The LsarLookupNames3 operation seems to resolve usernames to SIDs.
Using the open files tool I tried identifying clients that were currently causing traffic. Keep in mind that there’s also traffic to those pipes that are absolutely valid. In my case I took some random clients and used “netstat –ano | findstr 445” to check if the SMB session remained open for more than a few seconds. Typically this would mean the client was actually hammering our domain controllers.
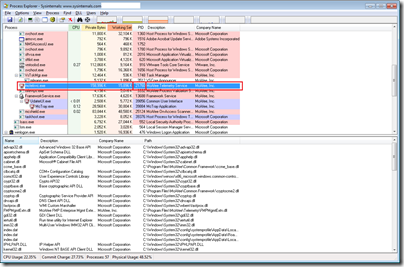
From this trace we can see that the process ID of the process performing the traffic is 33016. Using Task Manager or Process Explorer (SysInternals) you can easily identifiy the actual process behind this ID.
We could see that the process was WmiPrvSe.exe and that it’s parent process was Svchost.exe (C:\WINDOWS\system32\svchost.exe -k DcomLaunch). If you see multiple WmiPrvSe.exe processes, don’t be alarmed. Each namespace (e.g. root\cimv2) has it’s own process. Those processes are only running when actual queries are being handled.
In the above screenshot you can see, by hovering over the process, that this instance is responsible for the root\CIMV2 namespace. The screenshot was taken from another problem instance so the PID does not reflect the one I mentioned before.
The properties of the process / The threads tab:
You can clearly see that there’s a thread at the top which draws attention. If we open the stack:
Use the copy all button to copy paste in a text file:
…
RPCRT4.dll!I_RpcTransGetThreadEventThreadOptional+0x2f8
RPCRT4.dll!I_RpcSendReceive+0x28
RPCRT4.dll!NdrSendReceive+0x2b
RPCRT4.dll!NDRCContextBinding+0xec
ADVAPI32.dll!LsaICLookupNames+0x1fc
ADVAPI32.dll!LsaICLookupNames+0xba
ADVAPI32.dll!LsaLookupNames2+0x39
ADVAPI32.dll!SaferCloseLevel+0x2e26
ADVAPI32.dll!SaferCloseLevel+0x2d64
cimwin32.dll!DllGetClassObject+0x5214
…
framedynos.dll!Provider::ExecuteQuery+0x56
framedynos.dll!CWbemProviderGlue::ExecQueryAsync+0x20b
wmiprvse.exe+0x4ea6
wmiprvse.exe+0x4ceb
..
We can clearly see that this process is the one performing the lookups. Now the problem remains… Who ordered this (WMI) query with the WMI provider? WmiPrvSe is only the executor, not the one who ordered it…
In order to get to the bottom of this I needed to find out who performed the WMI query. So enabling WMI tracing was the way to go. In order to correlate the events, it might be convenient to know when the WmiPrvSe.exe procss was created so that I know that I’m looking at the correct events. I don’t want to be looking at one of the the many SCCM initiated WMI queries! In order to know what time we should be looking for events, we’ll check the Security event log.
Using calc.exe we can easily convert the PID: 33016 to HEX: 80F8. Just set it to programmer mode, enter it having Dec selected and then select Hex
In our environment the security event log has entries for each process that is created. If that’s not the case for you, you can play around with auditpol.exe or update your GPO’s. We can use the find option and enter the HEX code to find the appropriate entry in the security event log. You might find some non related events, but in my case using the HEX code worked out pretty well. The screenshot is from another problem instance, but you get the point.
So now all we need is WMI tracing. Luckily with Windows 7 a lot of this stuff is available from with the event viewer: Applications and Services Log > View > Show Analytic And Debug Logs
Microsoft > Windows > WMI-Actvitiy > Trace
One of the problems with this log is that it fills up quite fast. Especially in an environment where SCCM is active as SCCM relies on WMI extensively. This log will show each query that is handled by WMI. The good part is that it will include the PID (process identifier) of the process requesting the query. The challenge here was to have tracing enabled, make sure this specific log wasn’t full as then it would just drop new events, and have the issue, which we couldn't reproduce, occur… With some hardcore patience and a bit of luck I found an instance pretty fast.
So I correlated the events with the process creation time of the WmiPvrSe.exe process:
First event:
Followed by:
Basically it’s a connect to the namespace, execute a query, get some more information and repeat process. Some of the queries:
- SELECT AddressWidth FROM Win32_Processor
- Select * from __ClassProviderRegistration
- select __RELPATH, AddressWidth from Win32_Processor
- select * from msft_providers where HostProcessIdentifier = 38668
- SELECT Description FROM Win32_TimeZone
- …
And the last ones:
GroupOperationId = 260426; OperationId = 260427; Operation = Start IWbemServices::ExecQuery - SELECT Name FROM Win32_UserAccount; ClientMachine = Computer01; User = NT AUTHORITY\SYSTEM; ClientProcessId = 21760; NamespaceName = \\.\root\CIMV2
Now the Select name FROM Win32_UserAccount seems to be the winner here. That one definitely seems to be relevant to our issue. If we open up the MSDN page for WIN32_UserAccount: link there’s actually a warning: Note Because both the Name and Domain are key properties, enumerating Win32_UserAccount on a large network can negatively affect performance. Calling GetObject or querying for a specific instance has less impact.
Now the good part PID 21760 actually leads to something:
The process we found seems to be a service from our antivirus solution:
The service we found to be the culprit is the McAfee Product Improvement Program service (TelemetryServer, mctelsvc.exe). Some background information from McAfee: McAfee.com: Product Improvement Program
In theory this is the info they are gathering:
- Data collected from client system
- BIOS properties
- Operating System properties
- Computer model, manufacturer and total physical memory
- Computer type (laptop, desktop, or tablet)
- Processor name and architecture, Operating System architecture (32-bit or 64-bit), number of processor cores, and number of logical processors
- Disk drive properties such as name, type, size,and description
- List of all third-party applications (including name, version, and installed date)
- AV DAT date and version and Engine version
- McAfee product feature usage data
- Application errors generated by McAfee Processes
- Detections made by On-Access Scanner from VirusScan Enterprise logs
- Error details and status information from McAfee Product Logs
I don’t see any reason why they would need to execute that query… But the event log doesn’t lie. In order to be absolutely sure that this is the query that resulted in such a massive amount of traffic we’ll try to execute the query we suspect using wbemtest.
Start > Run > WbemTest
If you have Network Monitor running alongside this test you’ll see a lot of SAMR traffic passing by. So it seemed to be conclusive. The McAfee component had to go. After removing the Product Improvement Program component of each pc we can clearly see the load dropping:
To conclude: I know this is a rather lengthy post and I could also just have said “hey, if you have a lsass.exe CPU issues, just check if you got the McAfee Product Improvement Program component running” but with this kind of blog entries I want to share my methodology with others. For me troubleshooting is not only fixing the issue at hand. It’s also about getting an answer (what? why? how?) and it’s always nice if you learn a thing or two on your quest. In my case I learned about WMI tracing and lsarpc/samr. As always feedback is appreciated!


15 Response to Active Directory: Lsass.exe High CPU Usage
Indeed good work and thanks for this outstanding analysis!
cheers, Maurice
Wow, good find and very nice write-up!
Great work, Thomas. CPU activity on all of our DCs is significantly reduced now that I've disabled the product improvement program.
Nothing on the McAfee Knowledge Base that I can see.
Nice Post, thank you very much for sharing.
McAfee was the problem in my environment also. Time to go shopping for a new endpoint security solution..
I can't find the Active Directory Diagnostics collector set. I am trying to investigate high lsass.exe cpu usage on an Azure server.
Is the server your investigating a domain controller?
Thomas, in my case, it's not Domain controller.
How to find this collector?
Damn...technical...You got everything here ..
@Thomas This is the most detailed investigation for the problem we have,especially because our environment is identical. I will try to investigate has good has you! Too bad we don't have McAffe!
I hope it helps you :) The idea of a post like this is not only offer "the" answer but provide some insights and tricks how to find the actual issue and learn a thing or two in the process. As I can assure I learned a thing or two as well :) Good luck finding your problem!
Awhile back, I had to assist an unnamed customer troubleshoot high cpu utilization for lsass that was causing a major, multi-day outage for them. I should have commented on this and thanked you back then, as this post ultimately helped us follow the bread-crumb trail to resolve their problems. While McAfee was the source of your problem here, this procedure can apply to anything that might be sending some expensive queries to AD. Bravo and kudos to you on capturing everything from end to end!
In this customer's case it was the result of an accidental/naïve action from an admin using their systems management software (SCCM) to perform what is known as a 'baseline' against clients (https://docs.microsoft.com/en-us/sccm/compliance/deploy-use/deploy-configuration-baselines). Their aim via wmi script was to identify which users had local admin membership on their corporate issued PC. Unfortunately, they used code from the Internet not knowing what exactly it did. The code executed this against the Domain, rather than the Local Computer's SAM which was not their intention. Something to the tune of (can't recall exactly):
select * from Win32_AccountSID where Element = "Win32_Group.Domain=\REMOVEDNAME\",Name=\"Administrators\"""
So - "Give me all your users, and tell me which of them are Administrators", is ultimately what this did... but against the Domain rather than the Local Computer. Deployed to all PCs which essentialy caused an internal denial of service as you experienced herw ith McAfee. SCCM deploys this configuration baseline as PowerShell scripts (temporarily) to a local folder to execute the query (appear as GUID string values with .PS1 extension in the C:\WINDOWS\CCM\SYSTEMTEMP folder).
It was quite the adventure to narrow in on - but without your post it would have taken much longer.
Awesome! Thanks for taking the time to post back and share! It's really cool to see how you worked your way to a solution as well.
No problem! Again, I should have replied a few years back as it is old news now. Another customer in my neighborhood sounds like they are having similar issues today (not sure if actually LSASS high cpu related, but none the less - slow/no login problems).... so my ears starting ringing and I developed a nervous twitch just thinking about all the hours of lost sleep spent troubleshooting this last time (even with the help of your post). I was reminded of your post today because of that - so thought it best I come and thank you before Karma comes to drop an anvil on my head for not passing on the thanks!
Great deep-dive into troubleshooting LSASS
high cpu usage—especially appreciated the
WMI tracing and SAMR analysis. I’ve dealt with
a similar issue and wrote about optimizing Active
Directory query performance—might be helpful for
others in large environments too!
Add Your Comment